You might know that the Australian government has set a target of 83 per cent of our energy coming from renewable sources by 2030 and has also committed to reaching Net Zero emissions by 2050.
But do you know how we’re going? What’s our progress been like along the path to a greater reliance on renewables and reducing greenhouse gas emissions? And how do we compare to the rest of the world?
We’ve had a look at the International Energy Agency’s (IAE’s) tracking data, as well as information from the Department of Climate Change, Energy, the Environment and Water (DCCEEW), and a handful of other official sources, to gather some facts and figures.
We’ve drastically reduced our reliance on fossil fuels
Over the past 20 years, as the technology to generate energy from solar and wind has improved and become more readily available, Australia has significantly increased the proportion of energy coming from those sources.
At the same time, what was once a complete reliance on fossil-fuel-sourced energy has been dialled back to now being around 65 per cent.
As the following table of data from DCCEEW shows, where coal contributed about 83 per cent of our energy fuel mix at the turn of the century, in the most recent data that’s down to 47 per cent.
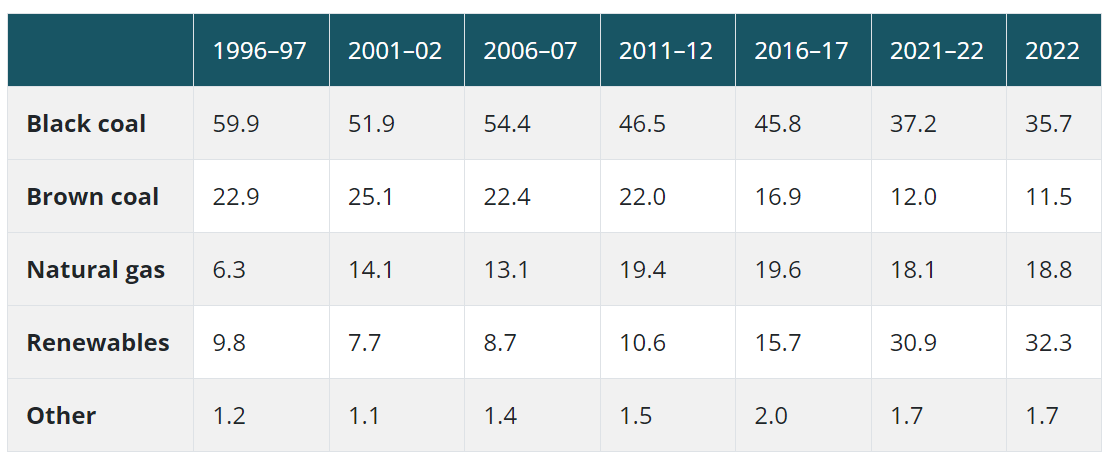
Source: Department of Climate Change, Energy, the Environment and Water (2023) Australian Energy Statistics
It’s worth noting that while the share of natural gas has remained steady for the past decade (from 2012 to 2022), the contribution of renewables has tripled.
We’ve needed more energy because we’re using more
According to data tracked by the IEA, while the amount of energy generated from coal in Australia has reduced slightly over the past 20 years, the amount sourced from oil and natural gas has risen significantly.
Of course, energy from solar and wind has had the sharpest increase, but that was coming from a pretty low base in 2000. Meanwhile, energy from hydro and biofuels has remained steady.
| Source | 2000 | 2005 | 2010 | 2015 | 2022 |
| Coal | 2.015.828 TJ | 2,136,730 TJ | 2,113,079 TJ | 1,797,035 | 1,919,198 TJ |
| Oil | 1,429,894 TJ | 1,545,478 TJ | 1,742,332 TJ | 1,777,010 TJ | 1,801.355 TJ |
| Natural Gas | 806,999 TJ | 794,321 TJ | 1,146,263 TJ | 1,384,157 TJ | 1,463,944 TJ |
| Wind, solar, etc | 3.763 TJ | 6,095 TJ | 30,113 TJ | 74,255 TJ | 250,556 TJ |
| Hydro | 58,896 TJ | 55,112 TJ | 48,607 TJ | 47,966 TJ | 58,669 TJ |
| Biofuels and waste | 210,841 TJ | 213,634 TJ | 205,015 TJ | 216,726 TJ | 194,336 TJ |
Source: International Energy Agency Data Services
To clarify the data in the above table: it represents the sources of energy used in Australia, not the sources of energy produced.
According to the IEA, Australia now exports nearly 70 per cent of the energy we produce, over 12.6 million TJ in 2022, an amount that has more than doubled since 2000 (5.3 million TJ).
Energy consumption offers a different perspective
As an energy retailer primarily supplying homes and small businesses, we tend to focus on electricity and gas for heating, cooling, and keeping the lights on and appliances running.
While this is probably in line with how most Australians think about energy, based on their own experience and usage, we need to keep in mind the bigger picture, which is that 38 per cent of Australia’s energy consumption is for transport and 29 per cent is used by industry.
The IEA data shows that only 14 per cent of total energy consumption in Australia in 2021 was by residential users.
Total final consumption (TFC) includes not only the energy used to heat and cool buildings, run appliances, and power vehicles and machines, but also non-energy uses of energy products, such as fossil fuels used to make chemicals.
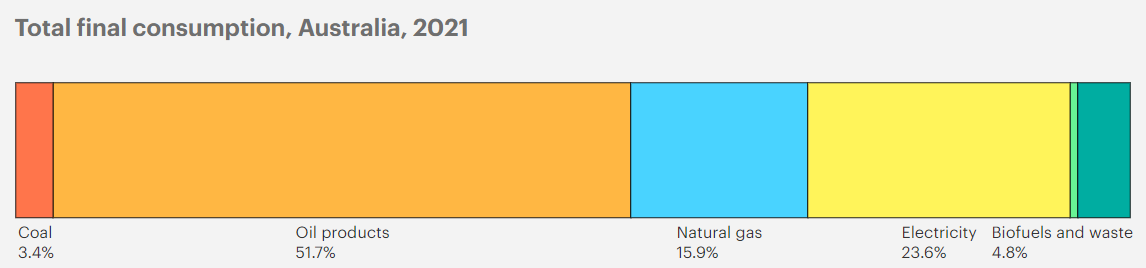
Source: International Energy Agency Data Services
That thin bright green strip between the yellow of Electricity and darker green of Biofuel and waste, representing well under one per cent of TFC, is Solar and wind.
Reducing emissions is another equation
Carbon dioxide (CO2) is the most prevalent greenhouse gas, so-called because it traps, absorbs, and radiates heat. While CO2 makes up less than one per cent of the Earth’s atmosphere, it is the primary greenhouse gas emitted through human activities.
In 2021, Australia produced around one per cent of global CO2 emissions from combustible fuels.
China and the United States together were responsible for 45 per cent of the global fuel combustion emissions, followed by the European Union, India, the Russian Federation, and Japan.
For comparison, China was responsible for more than 10,000 metric tons (Mt) of CO2 emissions in 2021 and India around 2,300 Mt, while Australia’s total Co2 emissions from fuel production and consumption was 360 Mt.
The per capita figures are something else
Per-capita energy-related CO2 emissions tend to be higher in more economically developed countries.
These per-person figures can also vary greatly depending on the structure of the economy and the energy system. For example, per-capita emissions will be higher in countries that rely more on carbon-intensive modes of transportation (like driving and flying), have a higher share of energy-intensive industries (like steel or chemicals) or depend heavily on fossil fuels for power generation.
While Australia has reduced its per-capita emissions by 17 per cent since 2000, we’re still at the top of the table in this metric.
Each year, we produce around 14 tons of CO2 emissions for every Australian. South Korea, which has a similar economy but a population of over 50 million, emits 11.7 tons per person, but China’s figure is about half that of Australia, at 7.5 tons, and India is way down the list at 1.6 tons per person.
The main sources of CO2 emissions in Australia are electricity and heat producers, transport, and industry, with the residential share fairly insignificant.
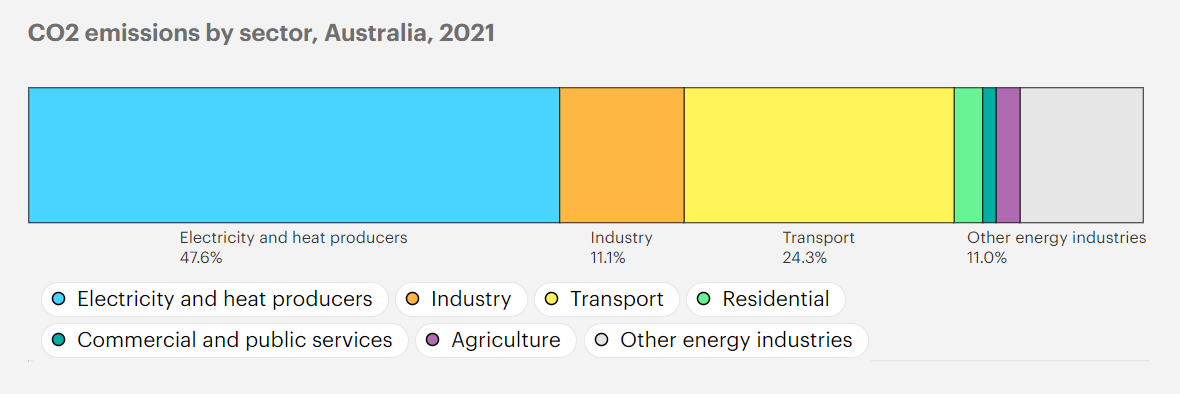
Source: International Energy Agency Data Services
Electricity consumption per capita is also quite high
When it comes to using electricity, Australians are not quite up there with the “best” in the world, but still with plenty of room for improvement.
Iceland leads the global rankings, using 51 MWh of electricity per person per year. That’s double the next highest per capita consumers in Norway (24 MWh), with Qatar (18), Kuwait (17.3), and Finland (15.6) rounding out the top five.
Canada is 7th (14.7 MWh per person), the USA is 9th (12.6), and Australia is ranked 15th, using 9.8 MWh per capita (which is down slightly from 11 MWh per capita about 10 years ago).
Other notable countries include Japan in 20th place (just on 8 MWh), Russia 23rd (7.2), Germany 31st (6.5), China 35th (5.8), and the UK 52nd (4.5). Our near neighbours in Indonesia use only 1 MWh per person while the Philippines comes in at 0.84.
Where is Australia improving?
While we’re seeing trends moving in the right direction with electricity use per capita and CO2 emissions, perhaps the best indicator of Australia’s progress toward a “greener” future is the IEA’s measurement adjusted for output.
This way of looking at the overall energy efficiency of a country measures the total energy supply per unit of economic output.
This reflects not only energy efficiency but also the structure of the economy, with services-oriented economies generally having a lower energy intensity than those based on heavy industry.
By this measure, Australia is trending more strongly in the right direction – that is, toward greater efficiency – having reduced this figure by 31 per cent between 2000 and 2022.
In other words, for every dollar’s worth of production in Australia, we’re using almost a third less energy than we did 20 years ago.
It’s a complex situation
There’s no magic bullet for any of this: using less electricity, creating fewer emissions while producing our energy, or using our energy more efficiently.
At the same time, it’s impossible to dismantle an existing system and its infrastructure and replace it with something else in anything short of perhaps half a century. There are so many existing technologies and systems that need to be transitioned away from, and that’s a gradual process. It’s difficult to strike the balance of keeping jobs, industry, and the economy going while maintaining a reasonable pace of the transition.
The rest of the world is grappling with all the same challenges, but at least we’re learning from each other, which is the best (possibly only) way to succeed. The good news is that the data clearly shows that the momentum of change is healthy and we have come a long way as a country.