Most Australians are acutely aware of the cost of living, with many households constantly weighing up whether they can afford discretionary spending, and some being forced to compromise to make ends meet.
There has been a significant shift in Australia’s cost-of-living landscape over the past decade, from what were relatively stable prices in 2015 to what now feels like a far tighter economy. Households have experienced dramatic changes across all major expense categories, from rent and mortgage repayments to groceries and the costs of running a car (petrol, insurance, registration, servicing and repairs).
The cost of energy continues to draw more attention and discussion than some other costs, even though it’s not a notable outlier to the trend of costs rising across the board.
Perhaps the additional focus on energy bills is due at least as much to political posturing and ideological debates around power generation sources as it is due to energy bills truly being a more significant burden than other regular household costs.
Everything has gone up more than we would like
It’s still hard to process what a different economic landscape Australia offered only 10 years ago. In 2015, inflation was low, house prices were moderate, and many of today’s cost-of-living pressures hadn’t yet emerged.
Fast forward to 2025, and Australian families are navigating a markedly more expensive environment across virtually every aspect of daily life.
The changes haven’t been uniform across the country. While some costs have risen steadily, others experienced dramatic spikes during specific periods, particularly during the COVID-19 pandemic and its aftermath.
Meanwhile, the average weekly wage has risen by about a third over the past decade (according to Australian Bureau of Statistics data) from $1,537.30 to $2,061.90.
The cost of housing has seen the most dramatic rises
Perhaps no sector illustrates the cost-of-living changes more starkly than housing, both for home buyers (reflected in home loan amounts and therefore repayments) and renters.
| City | Average House Price | Average Monthly Rent | ||||
| 2015 | 2025 | Increase | 2015 | 2025 | Increase | |
| Sydney | $930,000 | $1,691,731 | 82% | ~$2,300 | $3,552 | 54% |
| Melbourne | $650,000 | $1,035,887 | 59% | ~$1,400 | $2,295 | 64% |
| Brisbane | $470,000 | $1,020,000 | 117% | ~$1,730 | $2,531 | 46% |
| Perth | $550,000 | $918,000 | 67% | ~$1,860 | $2,449 | 32% |
| Adelaide | $490,000 | $1,000,000 | 104% | ~$1,520 | $1,989 | 31% |
These increases represent some of the most significant cost-of-living pressures Australian households face, with rent now consuming over half of many couples’ monthly income in major cities.
The cost of many weekly staples has risen significantly
Anyone who shops for groceries has experienced regular “sticker shock” over the past few years, with some items seemingly becoming more expensive every shop and others taking big leaps in price.
The major supermarkets have recently made a concerted effort to rein in the amount and frequency of rises for many grocery items, but our experience is still that every basket or trolley load is at least a few dollars more than the previous week or fortnight.
While it depends on the city and even suburb where you live and shop, an average weekly shop that was $120-$130 in 2015 is now $170-$180 (according to Canstar Blue), an increase of around 38%.
Here’s a selection of items for which we were able to source approximate 2015 prices:
| Item | 2015 price (approx.) | 2025 price (approx.) | Increase |
| Milk (1 litre) | $1.40 | $1.70 | 21% |
| Bread | $2.80 | $4.50 | 60% |
| Eggs (dozen) | $4.50 | $6.80 | 51% |
| Weetbix (575g box) | $3.00 | $4.40 | 47% |
| Roast chicken | $11 | $12.50 | 14% |
| Rump steak (per kg) | $28.00 | $36.00 | 28% |
| Bega cheese (500g) | $4.00 | $10.50 | 162% |
| Vegemite (280g jar) | $5.50 | $6.20 | 13% |
| Arnott’s Scotch Fingers | $2.50 | $3.30 | 32% |
| Cadbury chocolate | $3.50 | $8.00 | 128% |
| Omo laundry powder (2kg) | $26.00 | $30.00 | 14% |
Transport, insurance, and entertainment are all more expensive
Whether you drive a car or take public transport, if you have to commute daily for work, you’re probably spending at least 30% and possibly as much as 50% more in 2025 than you were in 2015.
A monthly public transport pass (or equivalent) in Sydney or Melbourne was between $120 and $150 in 2015 and is now around $200. Meanwhile, with a litre of petrol costing around 50 cents more (on average) than it did 10 years ago, each tankful is at least $25 more, meaning many drivers are spending well over $100 more on petrol every month.
Insurance premiums have risen exponentially as insurers face more and larger payouts after natural disasters, and the cost of repairing or replacing homes and vehicles increases. Private health insurance cover also goes up every year, and despite the tax incentive to maintain private cover, more Australians are opting out.
If you like the occasional visit to the cinema, that now costs 50-70% more than it did 10 years ago, while dinner for two at a mid-range restaurant is around 30-40% more expensive than in 2015.
Electricity bills might not have risen as much as you think
As we’ve written about previously, there are many reasons for energy bills increasing over recent years, not least the cost of maintaining the network while also building and integrating new generation and transmission infrastructure.
We’ve also seen much larger fluctuations in the wholesale price of energy, as well as global factors having a more pronounced influence on the domestic market.
We looked back at an Australian Energy Market Commission (AEMC) report from 2015 to see how much households were paying for electricity in New South Wales (B1) and Victoria (D1):
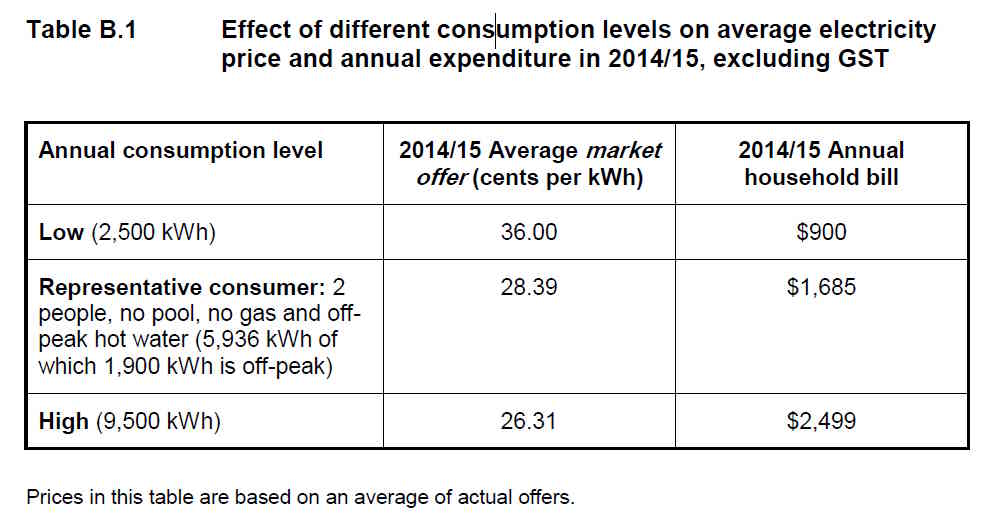
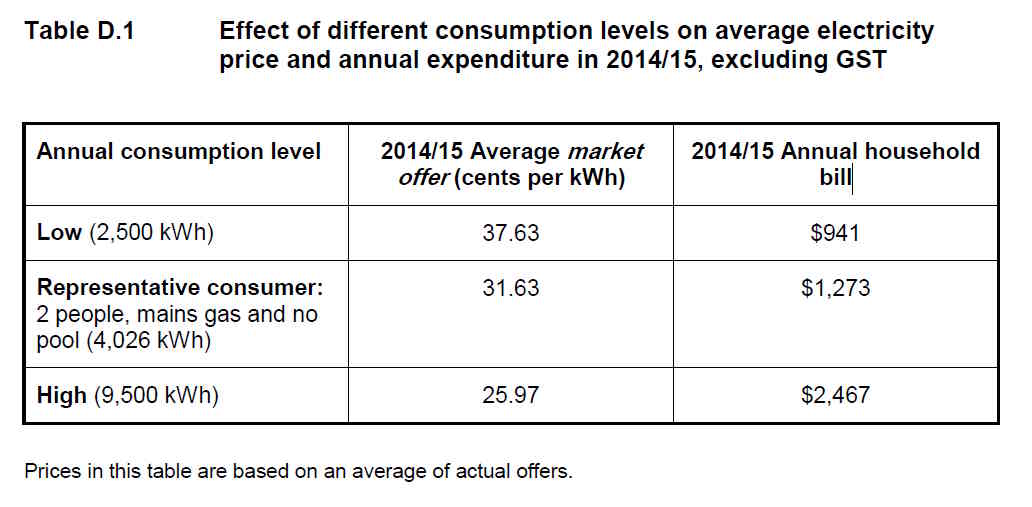
As you can see, in both states, what was considered low annual consumption of around 2,500 kWh cost around $1,000 and the high end for big families using nearly four times as much electricity each year was around $2,500.
According to various comparison sites, the average price of electricity across Australia now is between 33 and 40 cents per kWh. A typical NSW household, using around 4,000 kWh, will be paying close to $2,000 per year, while a similar home in Victoria on the Victorian Default Offer will have an annual bill of around $1,675.
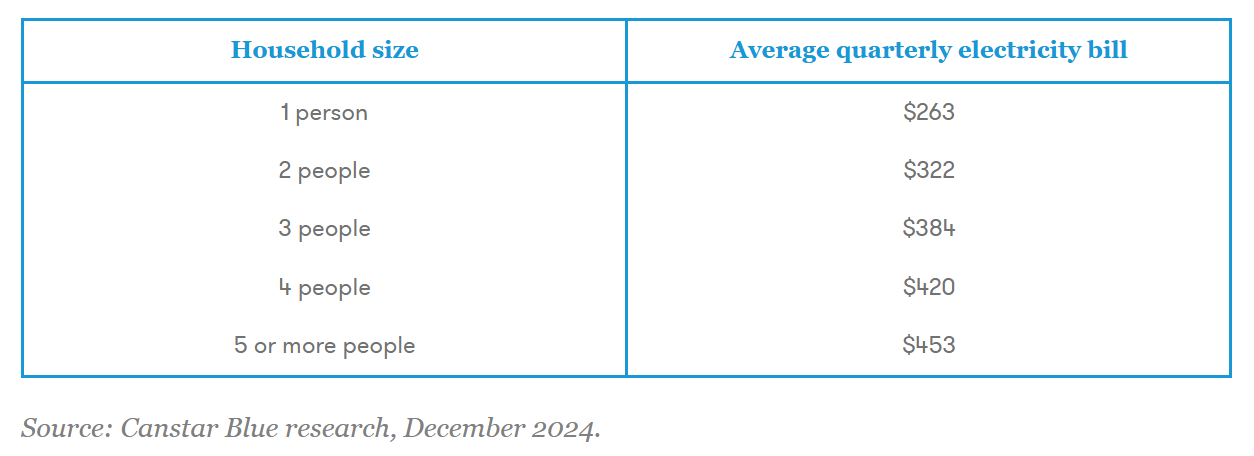
Canstar Blue, meanwhile, has found that the average bill for a four-person household across Australia (so some will be higher and others lower) is also around $1,680 per year ($420 per quarter).
If we take the middle figure in the 2015 Victorian table (D1) of $1,273 and compare that to the $1,680 Canstar Blue has found for a similar annual consumption of 4,000 kWh, that’s an increase of 32% over the decade.
In other words, while the cost of electricity has risen more than anyone would like, the increase is pretty much in line with the increases in many other living expenses and far less than the percentage increase in the cost of housing.
Housing affordability is squeezing everything else
The most striking finding from this decade-long comparison is the emergence of what many economists now term an “affordability crisis.” Housing now consumes 51-59% of household income in major cities, compared to the traditional benchmark of 30% and the 25-35% typical in 2015.
Not only is first-home ownership now much more difficult, but rental stress affects a much broader segment of the population. The result is that disposable income for other expenses has been squeezed.
We would all rather not be paying a few hundred dollars a year more for anything than we did 10 years ago, but if we weren’t paying thousands of dollars a year more on rent or tens of thousands repaying a mortgage, that additional $30 or $40 a month for electricity might be regarded differently.
Note: Figures in this analysis are based on available data and represent approximate averages. Individual experiences may vary significantly based on specific locations, housing types, and personal circumstances.